Multi-brand enterprises deal with a very specific analytics challenge: data exists, but it’s scattered, inconsistent, and hard to compare across properties. Each brand maintains its own GA4 property, sets up its event tags, and defines its reporting logic, often without alignment across the group.
What should be a basic business question, “Which brand is performing best this quarter?” turns into a time-consuming, manual reporting process. Data is pulled separately from each property. Analysts create custom spreadsheets. Visuals are built from scratch. Leadership reviews inconsistent numbers without confidence in the source.
This kind of setup slows down reporting and blocks decision-making, and in high-velocity marketing environments, that delay is expensive.
The real risks of brand-by-brand reporting
When GA4 properties are managed independently across brand sites, reporting breaks down quickly:
- Event misalignment: Similar actions are tracked differently across sites, “lead_submit” vs “form_complete”, making comparison unreliable.
- Inconsistent UTM parameters: Campaigns use varied naming conventions, disrupting UTM tracking in GA4 and making attribution across properties unreliable.
- Disconnected reporting structures: No centralized framework to benchmark or aggregate brand performance
- Manual reporting load: Analysts spend more time exporting and stitching than analyzing
- Delayed insights: Teams can’t act in real time when data is scattered across systems
All of this impacts your ability to run, report, and optimize campaigns across a multi-site ecosystem.
Why multi-brand reporting needs to start from a single view
The most effective multi-brand teams don’t just track performance; they compare, prioritize, and act. To do that, they need visibility that spans across sites. That means:
- One analytics framework applied across all properties
- A unified event model and UTM governance
- A single dashboard where performance is tracked, compared, and reported
With this setup, reporting moves from reactive to proactive. Teams don’t just collect metrics, they use them to inform campaigns, allocate spend, and respond to what’s working in real time.
Key metrics like total users, sessions, pageviews, bounce rate and average session duration become directly comparable across properties, no spreadsheets needed.
Consolidating GA4 reporting with Looker Studio
Multi-brand organizations often end up with multiple GA4 properties, each maintained separately.
To create a consolidated Looker Studio report for multiple GA4 properties, you can use a data control to dynamically switch between different GA4 properties. This allows users to select which site’s data they want to view within the report without needing separate reports for each site.
Here’s a step-by-step guide:
Step 1: Connect your GA4 properties
In the first step, you need to add the data source(s) to the Looker Studio report. While initially creating the Report, you will be prompted by default to set the data source. Later on, you can alter the data sources as well, go to “Add Data” and you can set the connector type (in this case, set it as Google Analytics GA4) and then select the GA4 property.
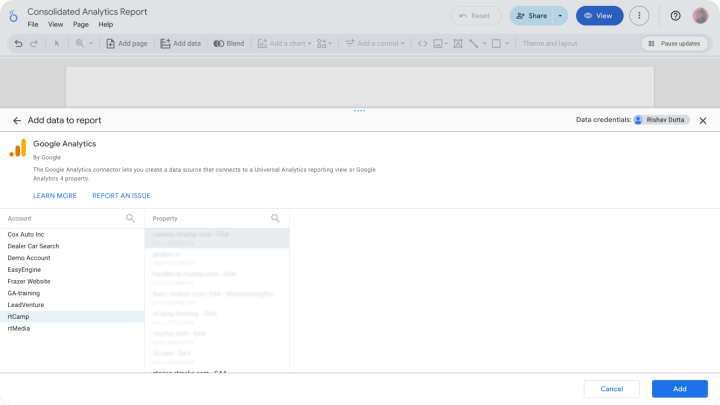
Figure: Add Data Source
Step 2: Create a data control
Next, on the particular page of the report, you have to add the “Data Control”. For this, navigate to “Add Control”, then select “Data Control”. Then in the sidebar, under “Data Control properties”, Select Connector type as “Google Analytics 4” and Data set type as “Google Analytics”.

Figure: Data Control
Step 3: Add and configure the charts
Next, you can add the charts to the report. Then you configure the charts, like the specific dimensions to be measured, and on the basis of which metric you want to measure. Also, you can add any filters to show a specific set of data.
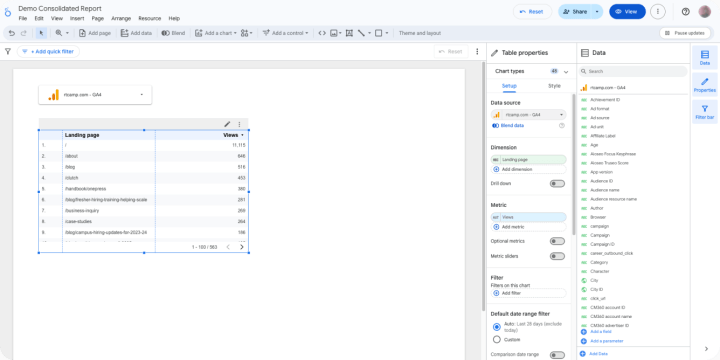
Figure: Add Charts
Step 4: View and test the chart
At last, you can view the report in View mode. While viewing, you can switch between the various data sources to which you have access.

Figure: Consolidated Report
A few limitations to keep in mind
- We cannot limit which data sources the user can switch to, since it allows the users to switch between any data sources of the specific type to which they have access.
- In some cases like, if the report is tracking some custom dimensions or metrics, and suddenly the user switches to some data source, where the custom dimension is not supported, the report will show broken charts with error messages.
Unified reporting for UTM performance
The UTM parameters for multiple sites that are being integrated with respective GA4 properties can be tracked in a unified manner from a single consolidated Looker Studio report.
Conventionally, there is a generic set of parameters based on which the UTM strings, specifically the campaigns, are being measured across the sites. Thus, for creating a consolidated tracking setup, you need to follow the steps below:
Step 1: Add a chart to the report
In this step, you need to create a chart with a generic set of dimensions and properties that are being used for tracking UTM strings. For example:
Traffic Acquisition Reports
In this scenario, you are going to track the UTM string performance for every session, irrespective of whether it is a first-time user or a repeat user. There is a specific set of properties that can be put into tracking, like
Dimensions
- Campaign
- Source Medium
- Manual ad Content
Metrics
- Sessions
- Engaged Sessions
- Key Events
- Engagement rate
- Conversion rate
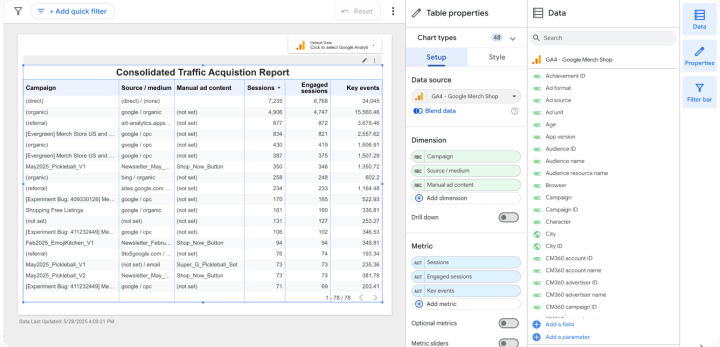
Figure: Unified Traffic Acquisition Report
User Acquisition Reports
In this scenario, you are going to track the UTM strings with respect to the first-time user who lands into the website. In this case, as well we can put a specific set of properties into tracking with a generic view across all the websites tracking.
Dimensions
- First User Campaign
- First User Source Medium
- First User Manual ad Content
Metrics
- Sessions
- Engaged Sessions
- Key Events
- Engagement rate
Note: You may have noticed that in both scenarios, the metrics seem to be the same.
Step 2: Add the data control
Next add the data control for the charts that you have added in the previous step. For this go to the “Add Control” and select the “Data Control” and select “Google Analytics – GA4”.
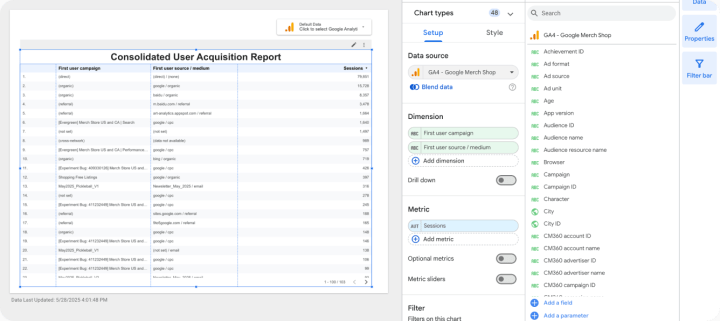
Figure: Consolidated User Acquisition
A before/after comparison
If you look into the reports created from the conventional approach, there might be either separate pages for every GA4 property or there can be multiple reports as well. But managing such a diverse chunk of data might overburden the stakeholders.

Figure: Conventional Reporting Approach
Thus, in the consolidated reports, you don’t need to handle multiple pages or separate reports. Instead, there will be a single report where you can easily change the data source by the provided control.

Figure: Consolidated Reporting of Page and UTM performances
Consolidating page performance reporting
The page performance reports can also be consolidated in a generic format with a holistic approach. For page performance, you can have a generic format.
Dimensions
- Landing pages (since a landing page is a key component in terms of marketing)
- Page Title
- Page path (for better deep dive understanding)
Metrics
- Views
- Sessions
- Engaged Session
- Active Users
- Bounce Rate
- Key Events
Unified tracking for key events
The key events give a very close and comprehensive understanding of the user engagement with the website. The key events can be tracked with a holistic approach. For this purpose, you need to take one step deeper with some tweaks in the data using filters.
At first, create a chart with a generic set of dimensions that will be tracked. In this case, the dimension that needs to be shown is “Event Name”. As a product manager or project manager, one of the most common metrics tracked is user acquisition on the platform. With this report of key events, you will be able to estimate various conversion events.
- But wait a minute and think 🤔, “Do all Events are Key Events ?”, the answer is “No”. So there is no point in tracking all events for conversions.
- Thus, to identify the key events from the entire list, you need to apply some filters.
Now, you need to add the filter to the chart. To add a filter, go to “Resources” → Manage Filters → Add Filters
This lets you report on what actually matters, with a unified view across all your brand properties.
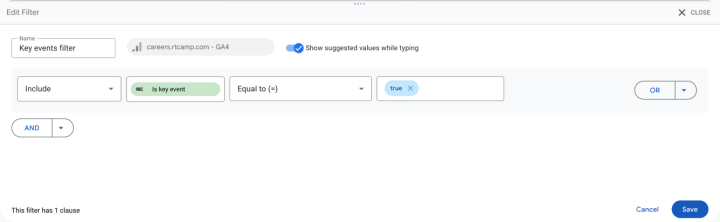
Figure: Filters for Key Events

Figure: Key Events Tracking
A scalable framework, built on what you already use
While the consolidated approach above uses Looker Studio, not every team is set up for it. Some prefer simpler workflows or tools that align better with their internal processes.
That’s exactly where OnePress fits in. It’s not a platform, product, or plugin. It’s a structured way of thinking, built to help multi-brand teams scale with what they already use, without getting locked into any system.
From content to analytics (essentially spanning the entire Martech stack) OnePress gives teams a repeatable model for building shared infrastructure across multibrand multisite environments without adding complexity.
If your teams are navigating fragmented tracking or struggling to scale their reporting across properties, we’d love to show you how this framework can help. Explore our OnePress handbook or get in touch to see how this structure can work for your stack.
The real risks of brand-by-brand reporting
Why multi-brand reporting needs to start from a single view
Consolidating GA4 reporting with Looker Studio
Step 1: Connect your GA4 properties
Step 2: Create a data control
Step 3: Add and configure the charts
Step 4: View and test the chart
A few limitations to keep in mind
Unified reporting for UTM performance
Step 1: Add a chart to the report
Step 2: Add the data control
A before/after comparison
Consolidating page performance reporting
Unified tracking for key events
A scalable framework, built on what you already use
On this page
Credits

Rishav Dutta
Author
Rishav Dutta
Author

Shreya Agarwal
Editor
Shreya Agarwal
Editor
Shreya Agarwal is a Growth Engineer at rtCamp, she brings active, hands-on WordPress development credentials to everything she writes and reviews. A WordPress Core Contributor with merged pull requ…
Related articles
-
What We Learned Implementing Server-Side Tagging on Our Own Website
Articles
-
Optimizely to WordPress migration guide
Articles
Comments
Leave a Reply Cancel reply
Name*
Email*
Comment*
Submit
Δ